Most restaurants in cities like Bogotá, Medellín, Cartagena, Mexico City, Miami, or Orlando lack clarity on which channels truly generate reservations, orders, or returning customers. Many operate blindly, relying on aggregators, social media, or paid advertising without a solid analysis of channel performance.
In 2026, a restaurant’s ability to grow profitably depends on one essential capability: Knowing exactly which channels sell, how much they sell, how much they cost, and how they interact with each other.
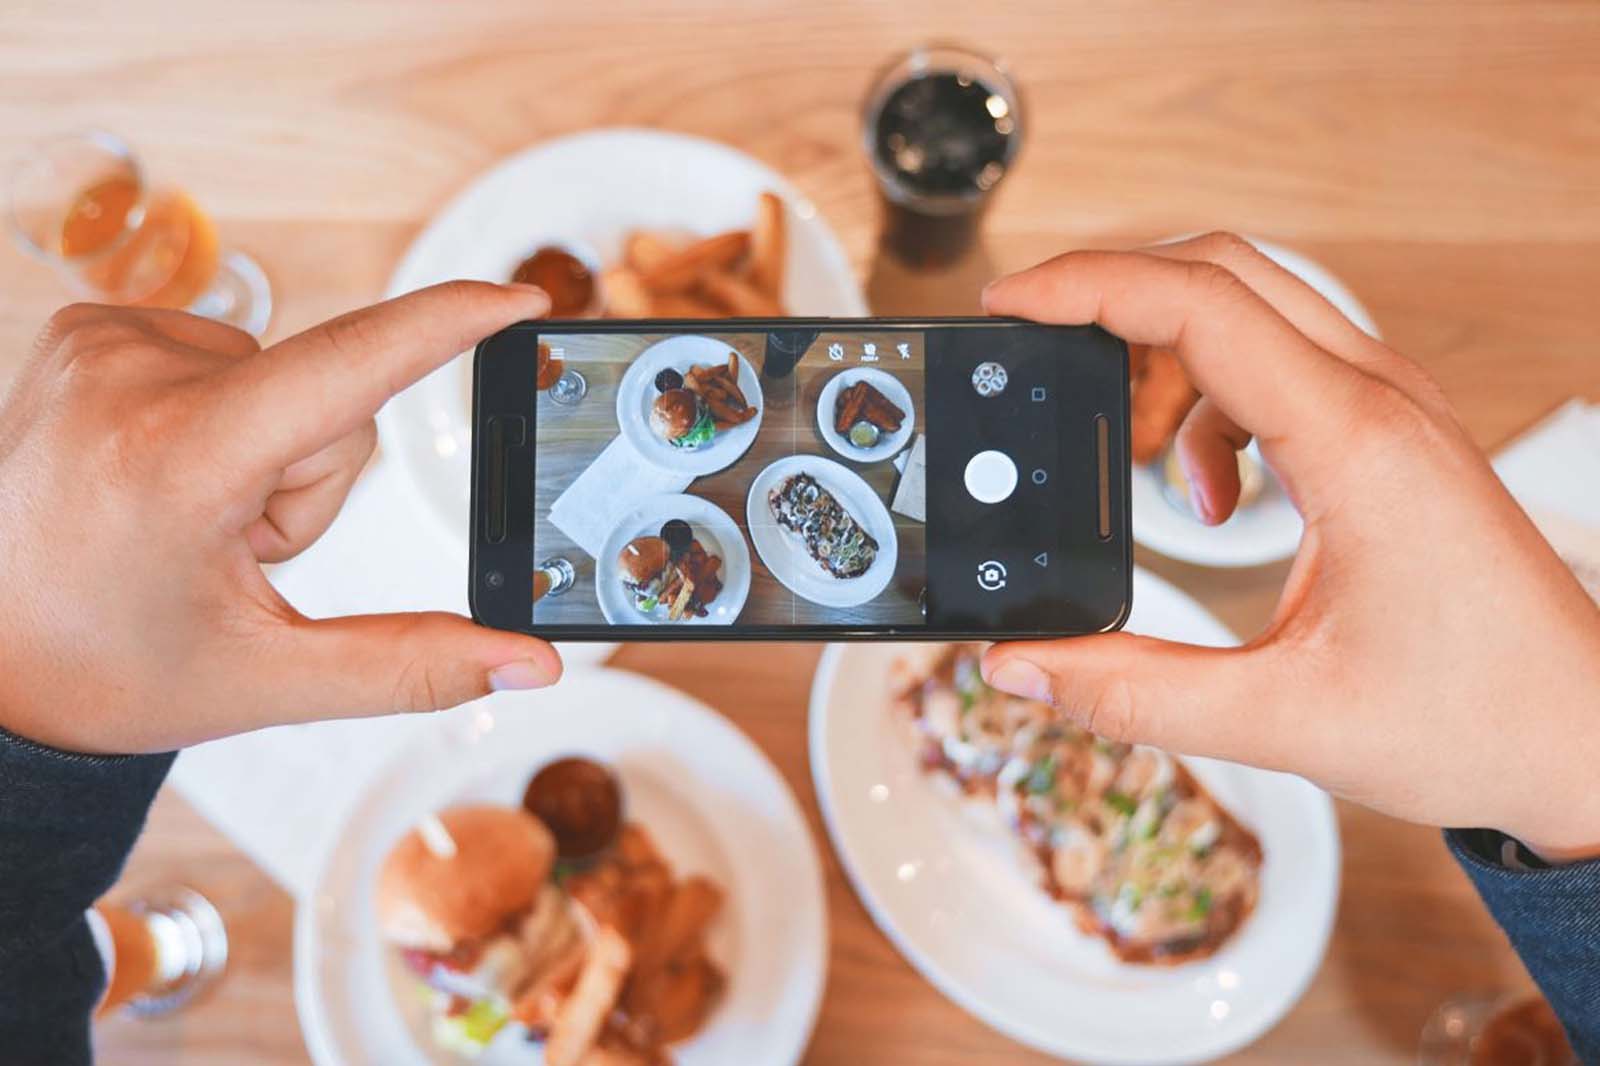
This article presents a practical guide to performing an X-ray analysis of reservations, orders, and visits—allowing restaurants to make data-driven decisions rather than relying on intuition.
Benefits of a Reservations X-Ray Analysis for Restaurants
Absolute clarity on which channels generate real sales
The restaurant can precisely identify which channels drive revenue and which ones only create noise or costs.
Optimized marketing budget
Investment is redirected to the channels with the highest performance, improving ROAS and margins.
Reduced dependency on intermediaries
With real data, the restaurant can balance the mix between aggregators, direct reservations, social media, and organic traffic.
Better customer experience
Understanding the diner’s journey allows optimizing key touchpoints: Digital menu, WhatsApp, web reservations, campaigns, and remarketing.
Greater customer recurrence
The analysis reveals which channels bring back customers—not just one-time purchases.
How to Map All Reservation Channels for Restaurants
Identify and classify all current channels
The first step is to list all channels generating traffic, intent, or reservations:
- Aggregators: Rappi, Uber Eats, DiDi Food, DoorDash
- Google Maps and local SEO
- Social media: Instagram, TikTok, Facebook
- WhatsApp and direct messages
- Website and digital menu
- Google Ads and Meta Ads
- Remarketing campaigns
- Organic traffic from blogs or menu content
- Referrals and direct traffic
Each channel must be classified by:
- Intent (high, medium, or low)
- Cost per acquisition
- Type of customer it attracts
- Average ticket
Consolidate all data into a single dashboard
Most restaurants analyze each channel separately. An X-ray requires integrating them.
Data sources:
- Google Analytics 4
- Google Business Profile
- Aggregator statistics
- Meta Ads and Google Ads
- Digital menu analytics
- Reservation system or CRM
- WhatsApp Business API
The objective is to build a dashboard that answers questions such as:
- Which channel initiates the most orders?
- Which channel converts the most reservations?
- Which channel brings customers with the highest average ticket?
- Which channel brings the most recurring customers?
- Which channel has the lowest cost?
Analyze attribution
Not all channels play the same role. Some generate discovery, others intention, and others conversion.
Typical channel roles:
- Social media: discovery
- Local SEO: medium intent
- Google Ads: high intent
- Aggregators: immediate conversion
- WhatsApp: personalized conversion
- Remarketing: customer recovery
Attribution analysis reveals the diner’s full journey.
Evaluate real costs per channel
Restaurants must calculate:
- Cost per acquisition
- Commissions
- Cost per impression or click
- Monthly advertising spend
- Hidden costs (operational time, packaging, logistics)
Aggregators typically have the highest cost. Google Maps and local SEO are usually the most profitable.
Measure average ticket per channel
Each channel brings different consumer behavior. For example:
- Aggregators: low or standard ticket
- Direct reservations: higher ticket
- Google Maps: local consumers with strong intent
- Social media: groups, celebrations, experiences
A channel with fewer reservations but a higher average ticket may be more profitable.
Measure recurrence
Without recurrence data, restaurants cannot understand which channels bring valuable customers.
Common findings from Digisap audits:
- Google Maps customers are 1.8x more likely to return.
- Direct reservations generate higher tickets.
- Social-media-acquired customers return if automation is active.
- Aggregator customers rarely become recurring guests.
Identify leaks and friction points
An X-ray often reveals:
- Channels with high reach but low conversion
- Menu pages with high abandonment
- Reservations lost due to lack of confirmation
- Campaigns attracting the wrong audience
Fixing these leaks increases sales without raising spend.
What to Do With the X-Ray Results: Strategic Actions
Redirect investment to the channel with the best ROAS
For most restaurants, the top performers are usually:
- Google Maps
- Local SEO
- High-intent Google Ads
- WhatsApp reservations
- Optimized digital menu
Reduce share of low-margin channels
The goal is not to eliminate aggregators but to balance them so they represent 20%–40% of the business, depending on the restaurant type.
Build your own funnel
This includes:
- Discovery on social media
- Intent on Google
- Conversion via direct reservations
- Retention through automation
Automate customer communication
To increase recurrence:
- Welcome sequences
- Abandoned order recovery
- Segmented promotions
- Birthday and special date messages
- Campaigns based on purchase history
Optimize the digital menu and reservation experience
The digital menu must be:
- Fast
- Clear
- With professional photos
- With visible CTAs
- Integrated with WhatsApp or direct reservations
Conversion happens here.
Real Cases of Restaurants Using a Reservations X-Ray
Restaurant in Bogotá
Problem: High dependency on aggregators.
Actions: Full tracking + SEO + Maps + automation.
Results:
- +52% direct sales
- +18% average ticket
- Commission reduction: 21% → 12%
Restaurant in Medellín
Actions: High-intent campaigns + local content + optimized digital menu.
Results:
- +46% clicks from Maps
- +33% new recurring customers
- CPA reduced by 28%
Restaurant in Mexico City
Actions: Consolidated data dashboard + budget redistribution.
Results:
- Campaign ROAS: 6.2x
- +41% direct reservations
Restaurant in Miami
Actions: Remarketing + automation + experiential content.
Results:
- +27% recurring customers
- +39% increase in branded searches
X-Ray Analysis as a Competitive Advantage for Restaurants
A restaurant that understands its channels controls its profitability. Key benefits:
- Full funnel control
- Less dependency on aggregators
- Higher average ticket
- More recurring customers
- Continuous optimization
- Data-driven decisions—not intuition
In increasingly competitive markets, data analysis becomes the real differentiator.
Support, Measurement, and Continuous Optimization with Digisap
Digisap applies the X-Ray model for restaurants through:
- Full channel audits
- Integrated dashboards for GA4, Maps, Ads, and CRM
- Local SEO strategies
- Intent-based campaigns
- Automation for retention
- Monthly channel optimization
- Quarterly strategic meetings
The goal is always the same: maximize direct sales and increase margin.
Request a Personalized Consultation to Map Your Reservation Channels
Discover which channels truly sell and how to optimize your restaurant’s commercial mix:
https://digisap.com/
Frequently Asked Questions
How long does a reservations X-Ray take?
Between 2 and 4 weeks depending on data access.
Which channel is usually the most profitable?
Google Maps and local SEO, followed by direct reservations.
Why shouldn’t aggregators be the only channel?
Because of high costs and low recurrence.
How do I know if I should redistribute budget?
The X-Ray dashboard will show which channels generate real sales.
Does Digisap implement the full X-Ray process?
Yes. It includes analysis, dashboards, strategy, and optimization.
Mapping all reservation channels is essential for any restaurant seeking growth in 2026.
The X-Ray method identifies which channels truly sell, which waste budget, and which actions should be prioritized to increase direct sales, recurrence, and margins.
With a data-driven commercial mix, restaurants become more competitive, more profitable, and less dependent on aggregators.
With Digisap, this becomes a continuous, structured, and scalable growth methodology.