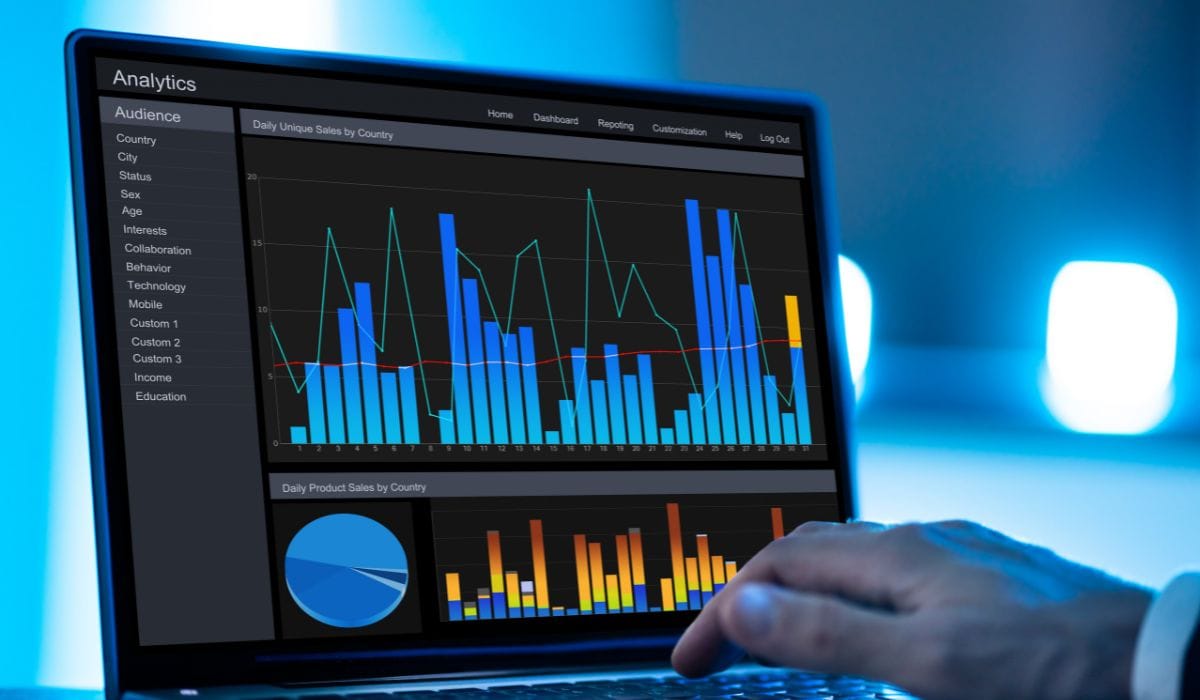
Social media is a core part of digital marketing for hotels and restaurants, but TikTok and Instagram don’t perform the same way or play the same role. A dashboard that puts both platforms side by side, using the same metrics and the same source of conversions, lets you decide with data where every dollar of your budget should go.
This guide covers which metrics to compare, how to avoid the most common reading mistakes and how to build the dashboard step by step.
Why compare TikTok and Instagram in one dashboard
Each platform has its own analytics panel, with different names, definitions and attribution windows. Reviewing them separately leads to misleading conclusions: TikTok may show millions of views and Instagram more engagement, yet neither number tells you which one drove more bookings.
A unified dashboard fixes that by measuring both platforms against the same business KPIs. It is a practical application of data analytics for marketing: moving from vanity metrics to investment decisions.
The metrics worth comparing
Reach, impressions and frequency
Reach tells you how many unique people saw your content, impressions how many times it was shown, and frequency how many times each person saw it on average. Comparing all three shows whether a platform is reaching new people or repeating the same message to the same audience.
Engagement and video retention
Engagement rate (likes, comments, saves and shares over reach) shows how well your content connects. For video, retention matters just as much: the share of people who watch the full clip or at least half of it. TikTok often leads on organic reach, while Instagram can drive more engagement on posts with a specific offer.
CTR and cost per click
Click-through rate (CTR) measures the share of people who click after seeing an ad, and cost per click (CPC) tells you what each visit costs. Together, they show which creatives drive traffic efficiently.
Conversions and cost per booking
This is the heart of the analysis. Conversions are the actions that matter to the business: a booking on the hotel’s booking engine, a table reservation, a WhatsApp message or a submitted form. Cost per conversion shows what each one costs on each platform. A platform with more clicks can still have a higher cost per booking if its traffic converts less.
Revenue and return on ad spend
The bottom-line metric is how much revenue each dollar invested on each platform generates. For a hotel or restaurant, that means connecting ad spend to real sales from the booking engine, the point-of-sale system or the CRM, not just to what each social network reports.
How to read the data without comparing apples to oranges
- Different definitions: a “view” isn’t counted the same way on TikTok and Instagram. Compare equivalent metrics, such as reach or completed views, instead of numbers that just share a similar name.
- Different attribution: each platform credits conversions with its own time window and model, and both can claim the same booking. That’s why conversions should come from a single shared source, such as GA4 or your booking engine.
- Consistent UTM tags: every link should follow the same UTM structure (source, medium and campaign) so GA4 can correctly separate traffic from each platform.
- Campaign objectives: an awareness campaign isn’t measured the same way as a conversion campaign. Compare campaigns with the same objective.
How to build the dashboard step by step
- Define the business question. For example: which platform deserves more budget to fill rooms during the low season.
- Choose the KPIs. Five to eight metrics, from reach to revenue, with a written definition for each one.
- Connect the data sources. TikTok Ads and Meta (Instagram) data, GA4 for on-site behavior, and the booking engine, point of sale or CRM for sales.
- Standardize UTM tags across every ad and every link in bio.
- Design the views: a side-by-side comparison by metric, a monthly trend of each platform’s return and a campaign-level breakdown.
- Set a review cadence: weekly for creative and budget tweaks, monthly for investment decisions.
This is the process we follow in our analytics and dashboard projects, where every number on the dashboard should lead to a decision.
Use cases for hotels and restaurants
- Restaurant: the dashboard shows that TikTok brings more reach among new audiences, but Instagram converts better when a post includes a promotion with direct booking. The decision: use TikTok for discovery and focus offers on Instagram.
- Boutique hotel: Instagram drives more clicks to the website, but cost per booking turns out lower on TikTok thanks to a cheaper CPC. The decision: shift part of the budget to TikTok and test new creatives on Instagram before cutting spend.
- Restaurant group with several locations: splitting the data by location reveals that the same platform performs well in one city and poorly in another. The decision: allocate budget by location instead of as a single block.
Decisions the dashboard makes possible
With unified data, you can reallocate budget based on real return, pause creatives that drive reach but no bookings, adjust your content calendar based on video retention and back up your social media investment with sales figures. If you want those decisions turned into campaigns, our performance marketing team runs TikTok and Instagram ads with weekly performance reviews.
TikTok vs Instagram FAQ
Which platform is better for a hotel or a restaurant?
It depends on your goal and audience. TikTok tends to be more efficient for reaching new people, while Instagram is often stronger at converting people who already know the brand. The dashboard exists precisely to test that with your own data.
Which tool should I use to build the dashboard?
You can build it in Looker Studio or another visualization tool, connecting data from TikTok Ads, Meta, GA4 and your booking or sales system.
How often should I review the dashboard?
A weekly review lets you adjust creatives and budget, and a monthly one supports investment decisions. Checking it daily usually leads to reacting to normal fluctuations.
Why don’t TikTok and Instagram conversions match GA4?
Because each platform uses its own attribution window and model, and both can take credit for the same sale. For a fair comparison, use GA4 or your booking engine as the single source of truth.
A dashboard that tells you where to invest
Comparing TikTok and Instagram with the same metrics and the same source of conversions turns a debate about opinions into an investment decision. For hotels and restaurants, that means more direct bookings for every dollar spent on social media.
If you want a dashboard that compares your TikTok and Instagram campaigns against your real sales, book a diagnosis with our team.